What this is and who it is for
You can now see how your organisation actually uses its handbook — which articles employees read, which topics they go to, how many people are reading, and whether they arrive from Sia's answers.
Until now there was no structured way to tell which articles were read most, which content went undiscovered, or whether the AI assistant was being used. Decisions about what to update rested on instinct. These figures replace that with evidence, and let you show that the content investment is doing something.
Who can see it
• Administrators and owners only. Not regular employees or managers.
• Your data is stored separately per organisation.
What it is not. These are aggregate figures about content and adoption. They are not a way to monitor what any individual employee has read.
How to access and use it
The overview on the handbook front page
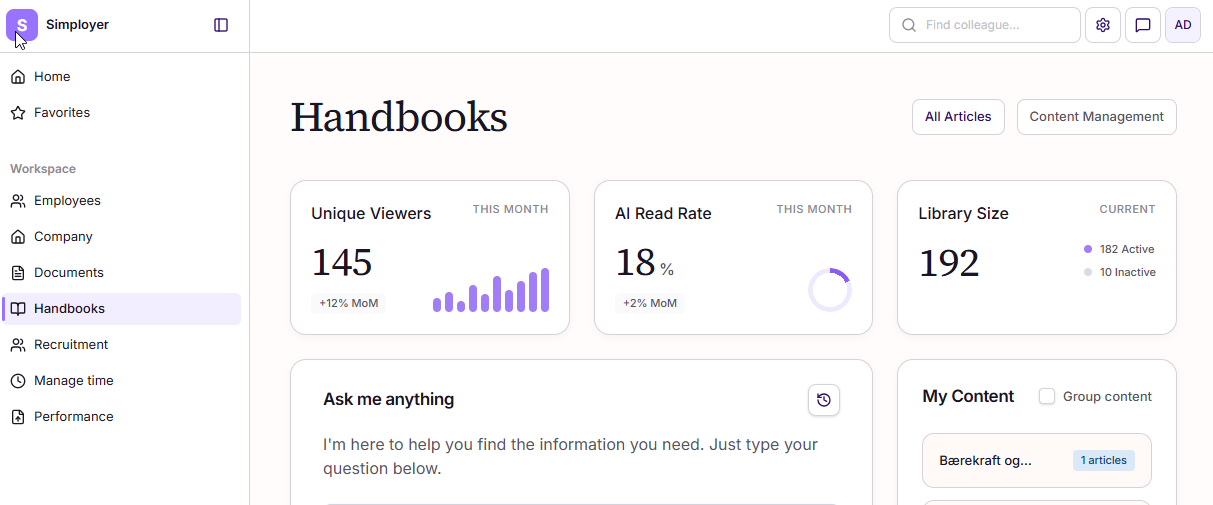
A summary appears on the handbook front page showing:
• Unique viewers — how many people have read at least one article.
• AI referrals — the share of viewers whose first article view came from one of Sia's answers.
• Library size — how much content your handbook holds.
The full view, under Content management
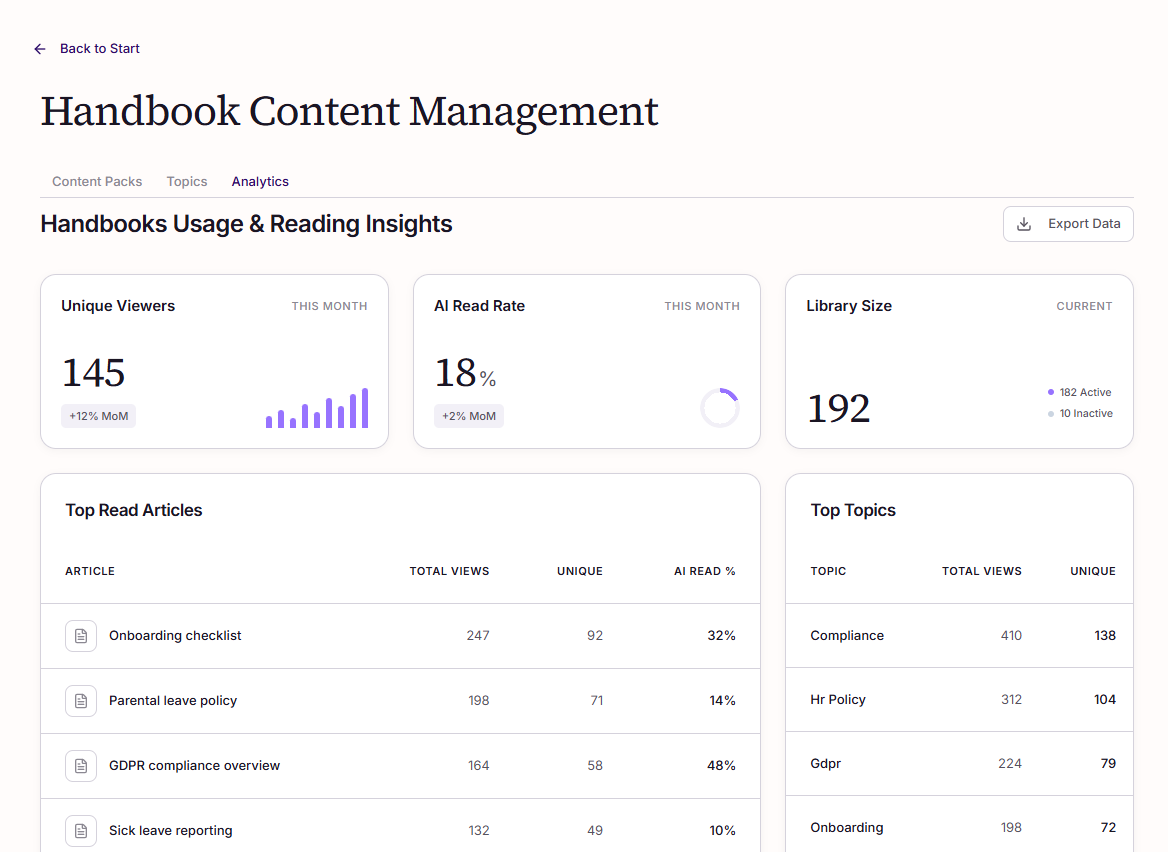
1. Open the Content management page.
2. Open the Analytics tab.
3. You will see Top articles, Top topics, Unique viewers, AI adoption and Library size, each with its change against the previous month.
Reading the figures
• Top articles and top topics tell you what employees actually come for. Content near the top is worth keeping accurate above everything else.
• Content that never appears is the more useful signal. An article nobody reads is either not needed, impossible to find, or written in a way that does not match how people search.
• Unique viewers, and the change against last month, tell you whether reach is growing. A drop after a reorganisation usually means navigation, not interest.
• AI adoption and AI referrals tell you whether people reach your content by asking rather than browsing.
Frequently asked questions
1. Can I see what a particular employee has read?
No. Figures are aggregated and there is no per-person view. This shows how content performs, not what individuals do.
2. What exactly does "AI referrals" count?
The share of viewers whose first article view in a period came from one of Sia's answers. Because it counts only the first visit, it understates Sia's overall influence — someone who browses first and asks Sia later is not counted. Treat it as a floor rather than a full measure.
3. Can I see what people asked Sia, or whether they found the answers useful?
Not yet. Questions asked in the AI chat, and ratings of AI answers, are not currently measured, so they do not appear here.
4. Why do the AI figures look incomplete?
The AI figures depend on data reported by the assistant itself. If that reporting is interrupted, AI adoption and AI referrals can under-report for the affected period while the other figures stay correct.
5. What period do the figures cover?
Each figure is shown with its change against the previous month.
6. Do employees see these figures too?
No. Both the front-page overview and the Analytics tab are visible only to administrators and owners.
7. We had usage figures in our old handbook. Are these the same?
This is the equivalent capability for Simployer One Handbooks. Handbooks Classic is a separate product with its own statistics — see the Handbook statistics article for that.
8. Does this cost anything?
No. There is no pricing change.
9. The numbers look wrong for a period when we were reorganising content.
Moving or renaming articles changes how they are counted. Read a sharp change across a reorganisation as a change in navigation rather than in interest, and compare again once the structure has settled.
Was this article helpful?
That’s Great!
Thank you for your feedback
Sorry! We couldn't be helpful
Thank you for your feedback
Feedback sent
We appreciate your effort and will try to fix the article